


Consult the main methodological aspects in detail in the U-Ranking Report
What are university rankings?
University rankings classify universities, allowing them to be compared by condensing heterogeneous information about their characteristics and results into one indicator. While these rankings simplify the complexity of reading the results, they offer a simple-straightforward classification with the advantages and disadvantages that this entails: they offer a more user-friendly assessment for those who do not have the time or the preparation to analyze the performance of a university in depth, but they hide differences between universities that could be of significance. Oversimplification is dangerous and, whenever possible, a ranking system should offer different information about the different dimensions of activities carried out by the universities and its performance in specific areas of knowledge or degrees.
Transparency and rigor are essential principles in the elaboration of a ranking. The construction of a ranking involves a certain amount of subjectivity when selecting variables and building and weighting indicators. In order to limit the effects of subjectivity, it is important to explain in detail the methodology used.
What methodology is used in U-Ranking?
U-Ranking provides a system of indicators of the performance results of Spanish universities, rigorous in its approach and following criteria derived from international studies and European Union proposals on the design conditions that a good ranking should have.
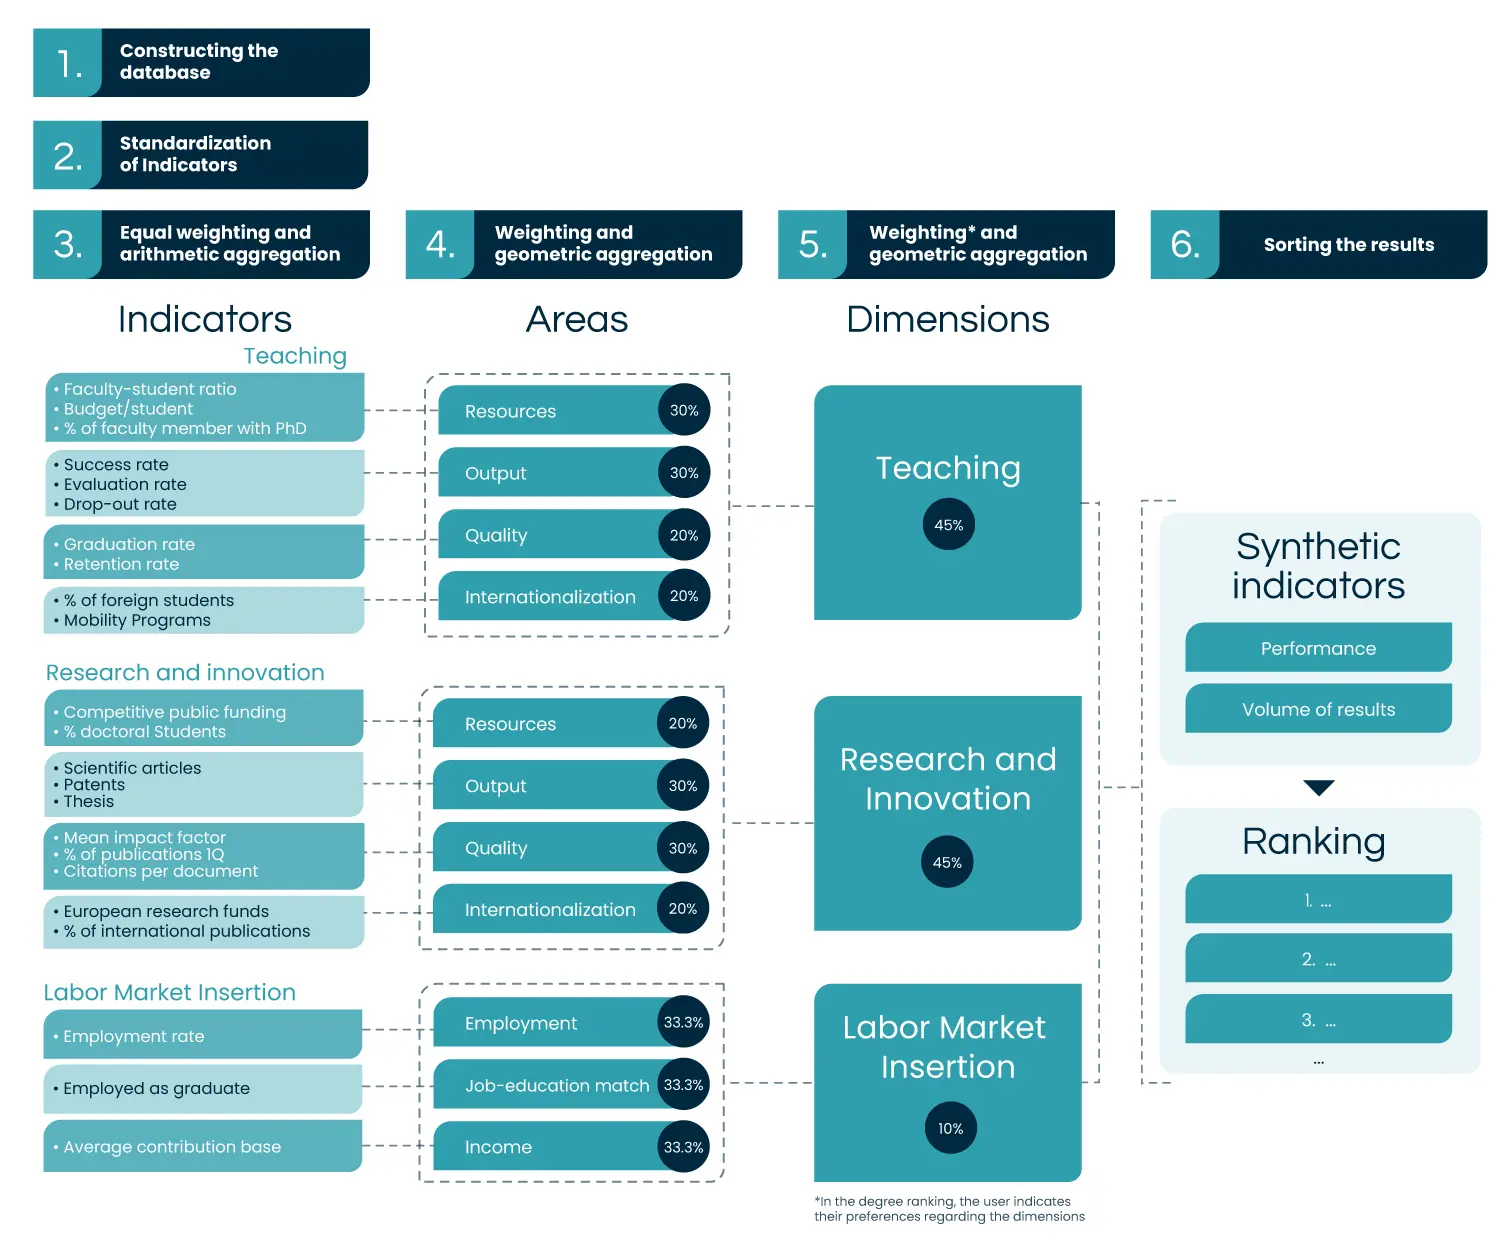
The research is approached with a careful analysis of the information provided by the simple and synthetic indicators used, evaluating the aggregation criteria used to change simple indicators into synthetic indicators, the sensitivity of the synthetic indices and the rankings that are derived from changes in the aggregation procedures. To create a ranking, it is necessary to select variables and manage, homogenize and incorporate diverse data. The complete process followed in the U-Ranking project is explained in detail in the reference document, with a summary below:
The importance of the specialization of each university
U-Ranking takes into account the different specialization of each university on two areas:
University activity
U-Ranking allows an independent analysis of the teaching activity, the research and innovation activity of the university and the employment outcomes of their graduates, recognizing the existence of different specialization profiles in the Spanish University System.
Areas of study
The project considers both the overall activity and outcomes of each university, as well as the results in each of the five fields of study.
What information is used to construct the rankings?
The U-Ranking index is built from 23 indicators grouped into three dimensions: 10 indicators to assess teaching activity, another 10 for research and innovation, and 3 to measure graduate employability. The ranking includes universities with available data for at least 20 of these 23 indicators. The data used come from public information systems and statistical sources.
To evaluate the teaching and the research and innovation activities of universities, four areas are considered within each of these two major dimensions: access to resources, output achieved, quality, and internationalization of activities. Meanwhile, the labor market insertion dimension considers three areas. The first focuses on employment levels, while the other two assess the quality of employment in terms of how well the job matches the graduate’s educational level and the income earned. The following table describes the indicators used, their data sources, time periods, and level of disaggregation for calculating the rankings by university
Teaching
| Indicator and definition | Source | Period | Disaggregation |
|---|---|---|---|
| Faculty member per 100 students: Full-time equivalent faculty members and research staff in centers belonging to the University per 100 full-time equivalent students in studies of 1st and 2nd cycle, Bachelor’s and Master’s degrees and students in Doctoral degrees (all of these students registered in centers belonging to the University) | SIIU | 2017/18 a 2022/23 | Area of study |
| Budget / Student: Effective income of the University by number of full-time equivalent students in studies of 1st and 2nd cycle, Bachelor’s and Master’s degrees and of students in Doctoral degrees (all of these students registered in centers belonging to the University) | SIIU/SABI/WEB | 2017/18 a 2022/23 | University |
| Faculty member with PhD / Faculty members: Full-time equivalent faculty members with PhD in centers belonging to the University over total full-time equivalent teaching and research staff in centers belonging to the University | SIIU | 2017/18 a 2022/23 | Area of study |
Research and Innovation
| Indicator and definition | Source | Period | Disaggregation |
|---|---|---|---|
| Competitive public funding secured for projects and research staff per PhD faculty member: Competitive public resources obtained for non-targeted research projects, including both projects and complementary actions, ERDF funds, and contracts such as FPI, Juan de la Cierva, Ramón y Cajal, and Technical Support, relative to the total number of full-time equivalent PhD faculty | Agencia Estatal de Investigación | 2018 a 2023 | Area of study |
| Percentage of doctoral students: Percentage of doctoral students over the total number of postgraduate students. | SIIU | 2018 a 2023 | Area of study |
Labor Market Insertion
| Indicator and definition | Source | Period | Disaggregation |
|---|---|---|---|
| Employment rate: Percentage of university graduates affiliated with Social Security and employed relative to the total number of graduates | SIIU | 2021 a 2023 | Area of study |
| Indicator and definition | Source | Period | Disaggregation |
|---|---|---|---|
| Employed as graduates: Percentage of university graduates employed in positions that match their level of education. University level is considered: Social Security contribution groups for professionals with higher education (engineers, graduates, senior management, and technical engineers) | SIIU | 2021 a 2023 | Area of study |
| Indicator and definition | Source | Period | Disaggregation |
|---|---|---|---|
| Average contribution base: Average annual contribution base of graduates working as employees with a full-time contract | SIIU | 2021 a 2023 | Area of study |